16 Jul 2026
Mapping Daily Transaction Logs to Stock Replenishment Strategies for Corner Retailers
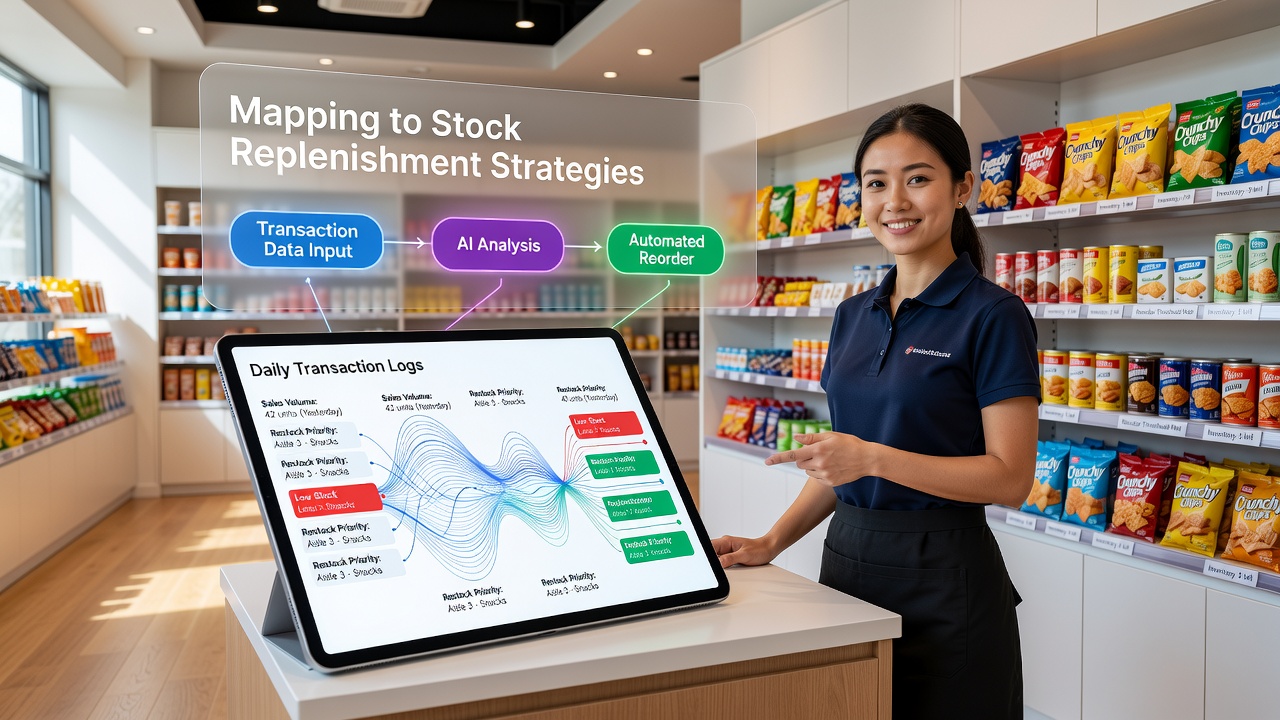
Corner retailers track every sale through point-of-sale systems that generate detailed transaction logs each day, and these records feed directly into decisions about when and how much inventory to reorder from suppliers. The process begins with raw data capture at the register, where timestamps, product SKUs, quantities sold, and payment types create a complete picture of daily movement across categories like snacks, beverages, and household essentials.
Retail operators then aggregate these logs into summary reports that highlight high-velocity items alongside slower movers, which allows them to adjust order quantities before shelves run empty or overstock accumulates in limited backroom space. Studies from retail management programs show that stores maintaining consistent log-to-replenishment mapping reduce out-of-stock incidents by measurable margins while keeping carrying costs lower than peers who rely on manual estimates alone.
Transaction Log Structure and Daily Aggregation
Each transaction entry typically includes date, time, item identifier, unit price, total amount, and any discounts applied, while batch processing at close of business compiles these entries into category-level summaries that reveal patterns across morning rushes, afternoon lulls, and evening peaks. Corner store owners often export these daily files into spreadsheet templates or lightweight inventory software that flags items falling below preset reorder thresholds based on the previous seven to fourteen days of movement.
Seasonal adjustments enter the picture when logs show sustained shifts, such as increased bottled water sales during heat waves or higher demand for cold remedies in winter months, and the mapping exercise incorporates weather data or local event calendars to refine those forecasts. Research indicates that integrating external variables with internal logs produces replenishment schedules that align more closely with actual customer traffic than static weekly orders.
Linking Sales Velocity to Reorder Triggers
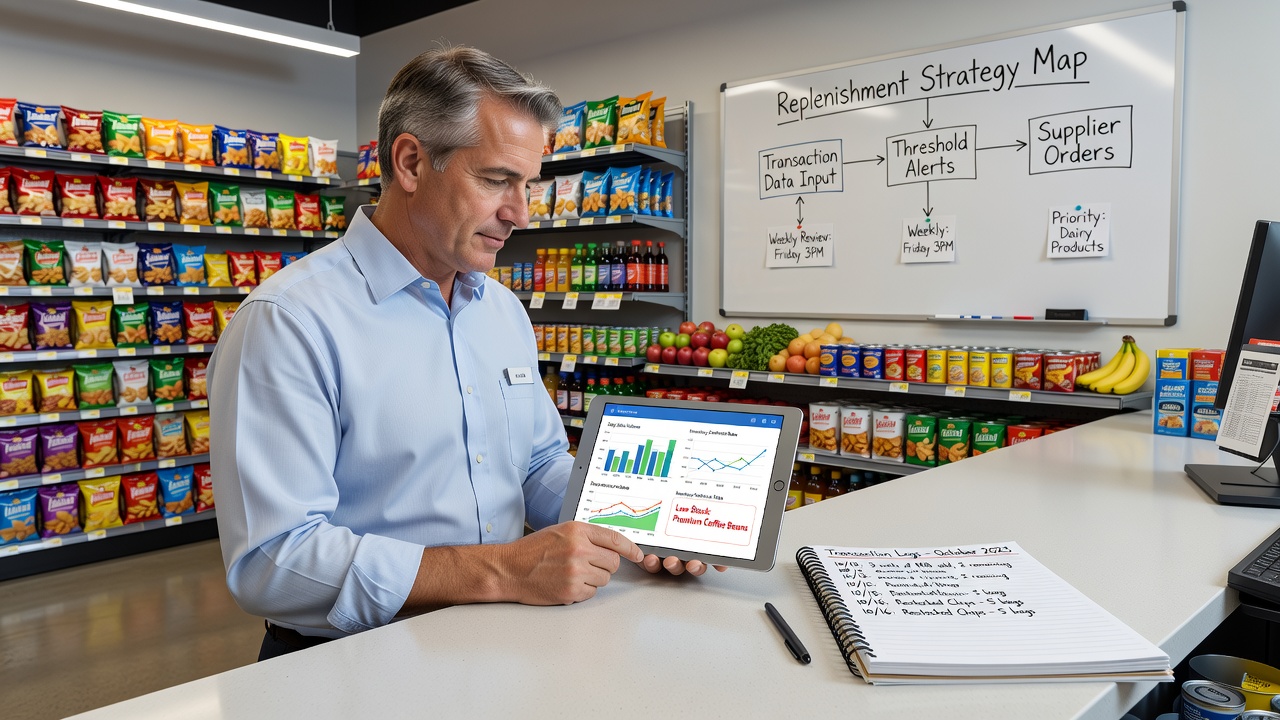
Velocity calculations divide total units sold by the number of days in the observation period, then compare the result against current on-hand counts to generate suggested order quantities that account for lead times from wholesalers. Stores using this method set minimum and maximum stock levels per SKU, which the system updates automatically when new transaction data arrives each evening. Observers note that automated triggers cut down on emergency supplier calls and help maintain fresher product rotation in perishable sections.
Multi-location operators sometimes centralize log analysis at a regional level while allowing individual sites to override suggested orders based on local events, and this hybrid approach balances scale efficiencies with responsiveness to neighborhood-specific demand spikes. Data from industry reports reveal that corner retailers who map logs this way experience fewer instances of forced markdowns on expired goods compared with those following fixed delivery schedules.
Technology Integration and Supplier Coordination
Modern point-of-sale platforms connect transaction logs to supplier portals through standardized file formats, enabling direct transmission of suggested orders that wholesalers review and confirm before dispatch. Integration reduces transcription errors that once occurred when staff copied numbers from paper ledgers into order forms, and it shortens the cycle from sale observation to shelf restocking. As of July 2026, adoption of cloud-based inventory modules among independent operators continues to rise according to figures from the U.S. Small Business Administration, which track technology uptake across retail segments.
Some wholesalers now offer shared dashboards that display a retailer's own transaction-derived forecasts alongside broader market trends, creating a feedback loop that refines future replenishment accuracy. Those who've studied these partnerships report smoother cash-flow timing because orders arrive closer to the moment stock is needed rather than on arbitrary weekly cycles.
Practical Examples from Independent Operators
Take one urban corner store that noticed consistent afternoon sales of energy drinks through its daily logs and adjusted mid-week deliveries upward while trimming morning bread orders that showed repeated overstock. The change freed cooler space for higher-margin items and reduced waste on baked goods that reached expiration before sale. Another suburban location mapped weekend transaction spikes in snack categories and coordinated with its distributor for split-case deliveries, which kept shelves full during peak periods without tying up capital in full-case purchases that sat idle midweek.
These adjustments rely on clean data mapping rather than intuition alone, and the same logs also support labor scheduling decisions when sales volume correlates with staffing needs. Government statistics from Statistics Canada on small retail operations confirm that inventory turnover rates improve when transaction records drive replenishment timing instead of fixed calendars.
Conclusion
Daily transaction logs supply the factual foundation for stock replenishment strategies that keep corner retailers responsive to actual customer demand while controlling costs associated with excess inventory and lost sales. The mapping process combines velocity metrics, threshold alerts, and supplier integration to create repeatable workflows that adapt as patterns shift over weeks and seasons. Continued adoption of connected systems supports more precise coordination between sales data and incoming shipments across independent retail locations.