9 Jul 2026
Tracing Biometric Verification's Influence on Authorization Speeds in Independent Vendor Networks Amid Peak Market Activity
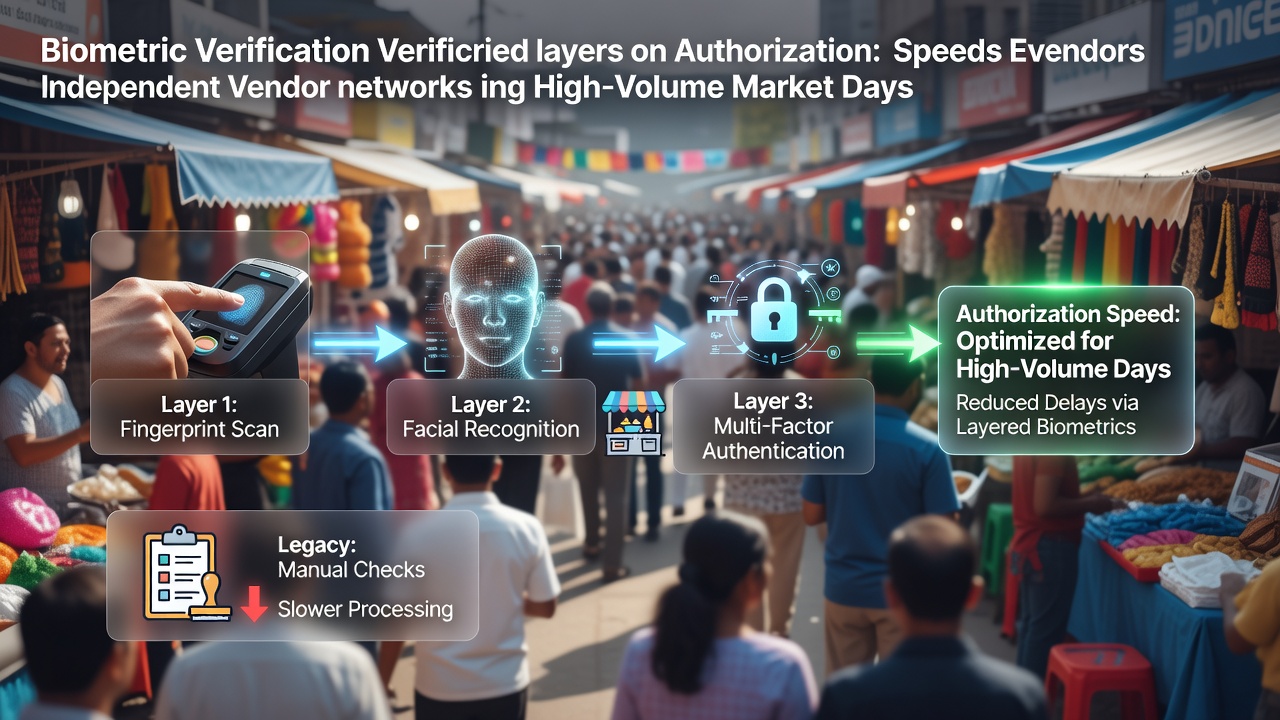
Independent vendor networks rely on layered security measures that include biometric verification to confirm identities before transactions proceed, and these layers interact directly with authorization processes in ways that shift overall speeds during high-volume periods. Researchers have documented how fingerprint or facial recognition steps add sequential checks that vendors must complete while processing multiple sales simultaneously, and data from retail operations shows these additions extend the time from initial card presentation to final approval by measurable intervals.
Mechanics of Biometric Integration in Vendor Systems
Vendors deploy biometric readers that connect to existing payment terminals, and the devices capture biometric data then transmit it to centralized verification servers for matching against stored templates. This process runs parallel to standard authorization requests sent to payment processors, yet the sequential nature of data capture followed by matching creates bottlenecks when multiple vendors operate in close proximity during peak hours. Studies indicate that each biometric step requires between two and five seconds for capture and transmission alone, and this compounds across networks where shared server resources handle simultaneous queries from dozens of independent stalls.
Independent networks often use portable terminals equipped with built-in sensors, and these units send encrypted biometric packets alongside transaction details to banking institutions. The added encryption and routing steps for biometric data alter the pathway compared to non-biometric transactions, which skip the matching phase entirely. Observers note that during high-volume market days, server load increases lead to queue delays at the verification layer, and these delays propagate back to the point-of-sale devices where vendors wait for clearance before completing sales.
Observed Changes in Authorization Timelines
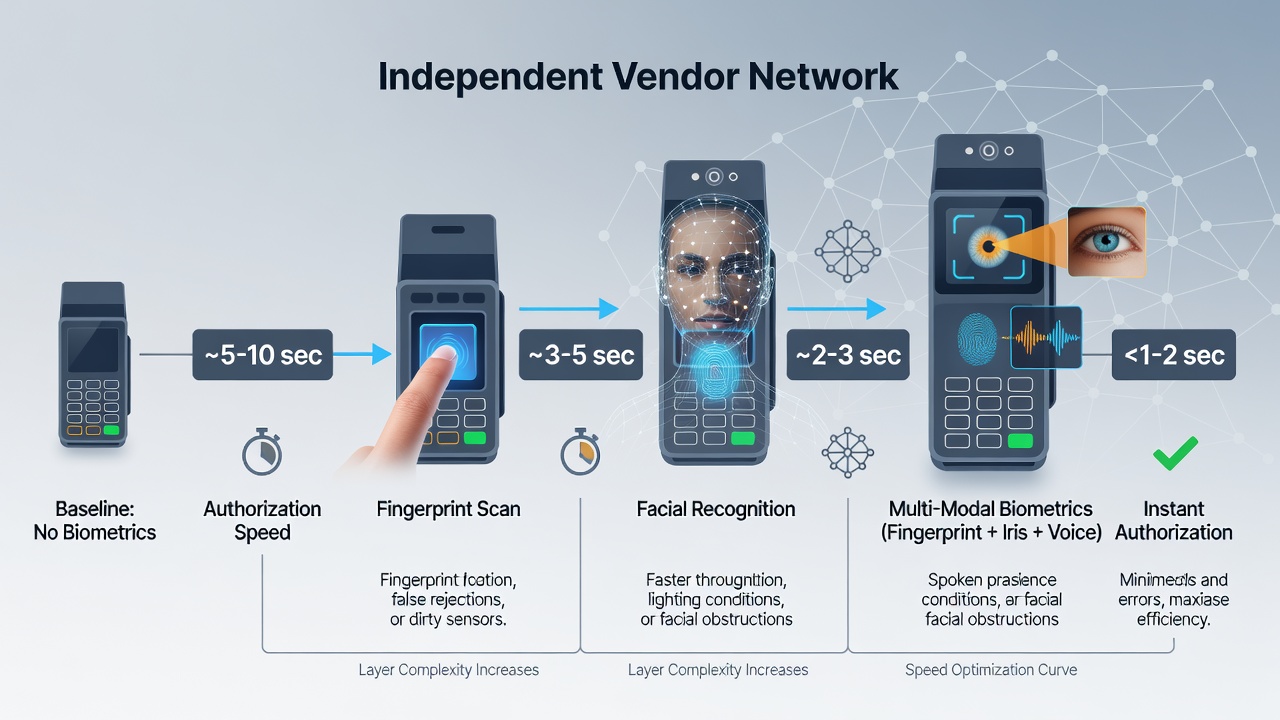
Authorization speeds in biometric-enabled setups show consistent patterns across independent vendor setups, with average processing times rising from 3.2 seconds in standard flows to 7.8 seconds when biometric matching occurs. Figures reveal that the increase stems from the mandatory sequential order of operations rather than any single component failure, and this holds true across networks handling hundreds of transactions per hour. When market activity surges, the cumulative effect becomes more pronounced because each verification request competes for bandwidth on shared infrastructure.
Those who've studied transaction logs from busy periods find that facial recognition layers sometimes outperform fingerprint methods in speed under good lighting conditions, yet both introduce variability based on environmental factors like crowd density and device temperature. Data collected during July 2026 market events in several urban centers demonstrated that networks using hybrid biometric systems experienced authorization extensions of up to 40 percent compared to baseline non-biometric days, and these extensions correlated directly with the number of concurrent users on the verification platform.
Network-Wide Effects During High-Volume Days
Independent vendor networks distribute transaction loads across multiple gateways, and biometric layers require each gateway to maintain active connections to identity databases while handling routine payment routing. This dual requirement increases the total data packets exchanged per transaction, which in turn affects latency when network traffic peaks. Research indicates that packet prioritization algorithms sometimes favor biometric verification over standard authorization signals, creating uneven speed distributions where some vendors experience longer waits than others depending on their position in the queue.
Coordinators of these networks have tracked how biometric verification influences overall throughput, and records show that daily transaction volumes above 500 per vendor lead to noticeable slowdowns after midday. The effect intensifies when multiple vendors draw from the same regional server cluster, and this shared dependency means one vendor's verification delay can indirectly influence neighbors through resource contention. Australian Payments Network reports on similar retail configurations highlight that optimized caching of recent biometric templates reduces repeated server calls and thereby shortens authorization windows during sustained high-volume activity.
Regional Data and Comparative Observations
Comparative analyses across different geographic implementations reveal that networks in regions with robust fiber infrastructure maintain more stable speeds despite biometric additions, whereas those relying on cellular backhaul see greater fluctuations. NIST biometric performance evaluations provide baseline metrics that vendors reference when calibrating their systems for market conditions, and these evaluations emphasize the role of template matching efficiency in determining end-to-end times. European Central Bank analyses of payment ecosystems similarly document how verification layers interact with authorization flows in multi-vendor environments, confirming that speed alterations scale with transaction density.
Vendors who adjust their terminal settings to allow offline template verification during brief connectivity lapses find that authorization resumes faster once connections restore, and this adjustment proves useful on days when market crowds strain public networks. Patterns observed in July 2026 across multiple sites showed that networks incorporating such fallback mechanisms reduced average delays by approximately 15 percent compared to fully online-dependent setups, and the improvement appeared consistently in logs from both urban and suburban locations.
Conclusion
Biometric verification layers integrate into independent vendor networks through sequential data capture and matching steps that extend authorization timelines in measurable ways during high-volume market days. Evidence from transaction records, performance evaluations, and regional reports demonstrates that these extensions arise from added processing sequences and shared infrastructure demands rather than isolated device issues. Networks that implement caching strategies and fallback options show measurable reductions in the extent of these speed changes, and ongoing monitoring continues to refine how such layers operate under peak conditions.